Trevor-Croteau-Data-Portfolio
This is a place for my journey through learning data science. I will include the code produced for each project of my mine as well as a brief description and the visualizations produced.
Project maintained by Edgy-Toast Hosted on GitHub Pages — Theme by mattgraham
Trevor Croteau's Data Science Portfolio
This is a place for my journey through learning data science. I will include the code produced for each project of my mine as well as a brief description and the visualizations produced. This page was first published March 23, 2022.
👨💻 What I'm Currently Doing
- Looking for a job in data analytics or software development.
- Completing a Google Data Analytics certificate from Coursera.
- Implementing data analytics to confirm the accuracy of my research's Monte Carlo integration
- Completing my Astronomy courses at Texas A&M.
🛠️ Languages and Tools
🦠 The Covid-19 Section
Data
Johns Hopkins University Center for Systems Science and Engineering (CSSE) has done a wonderful job at keeping up-to-date information on the novel Covid-19 pandemic. The github Covid-19 dataset can be found at https://github.com/datasets/covid-19 under an open-source license. It is already cleaned, and so we can begin on analysis steps.
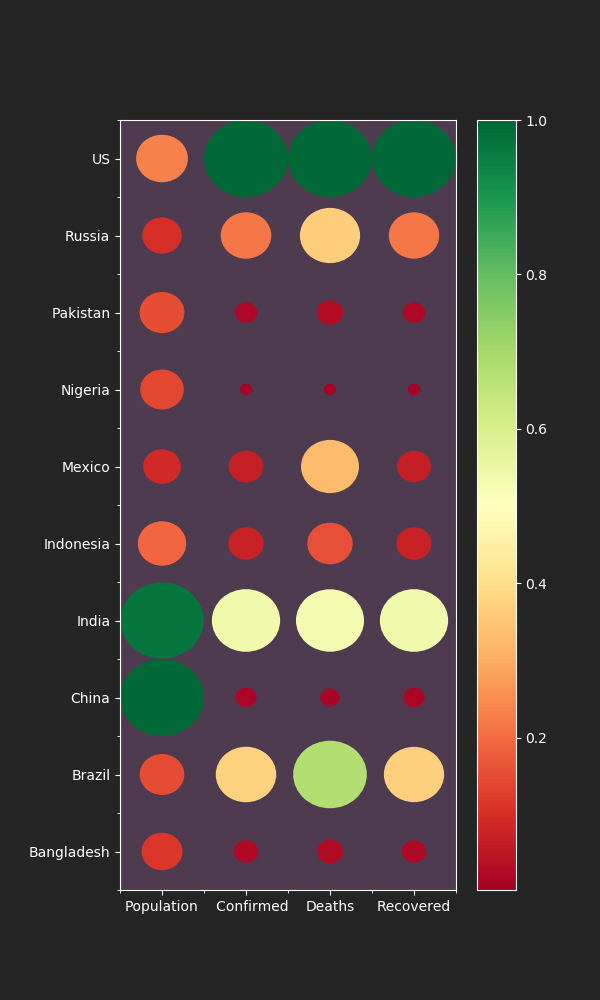
Confirmed Cases of Covid-19 for the 10 Most Populous Countries
Total Combined Deathrate of Covid-19 for the 10 Most Populous Countries
(as a % of confirmed cases)
Population Size Visualizations with Logarithmic and Non-Logarithmic Confirmed Cases
Can you spot any outliers? What may contribute?

🌊 The Sea Levels Section :
This is a project for a Climate Dashboard website: When published, this will be updated with its link. For now, we have simply demonstrations of what will be on the site.
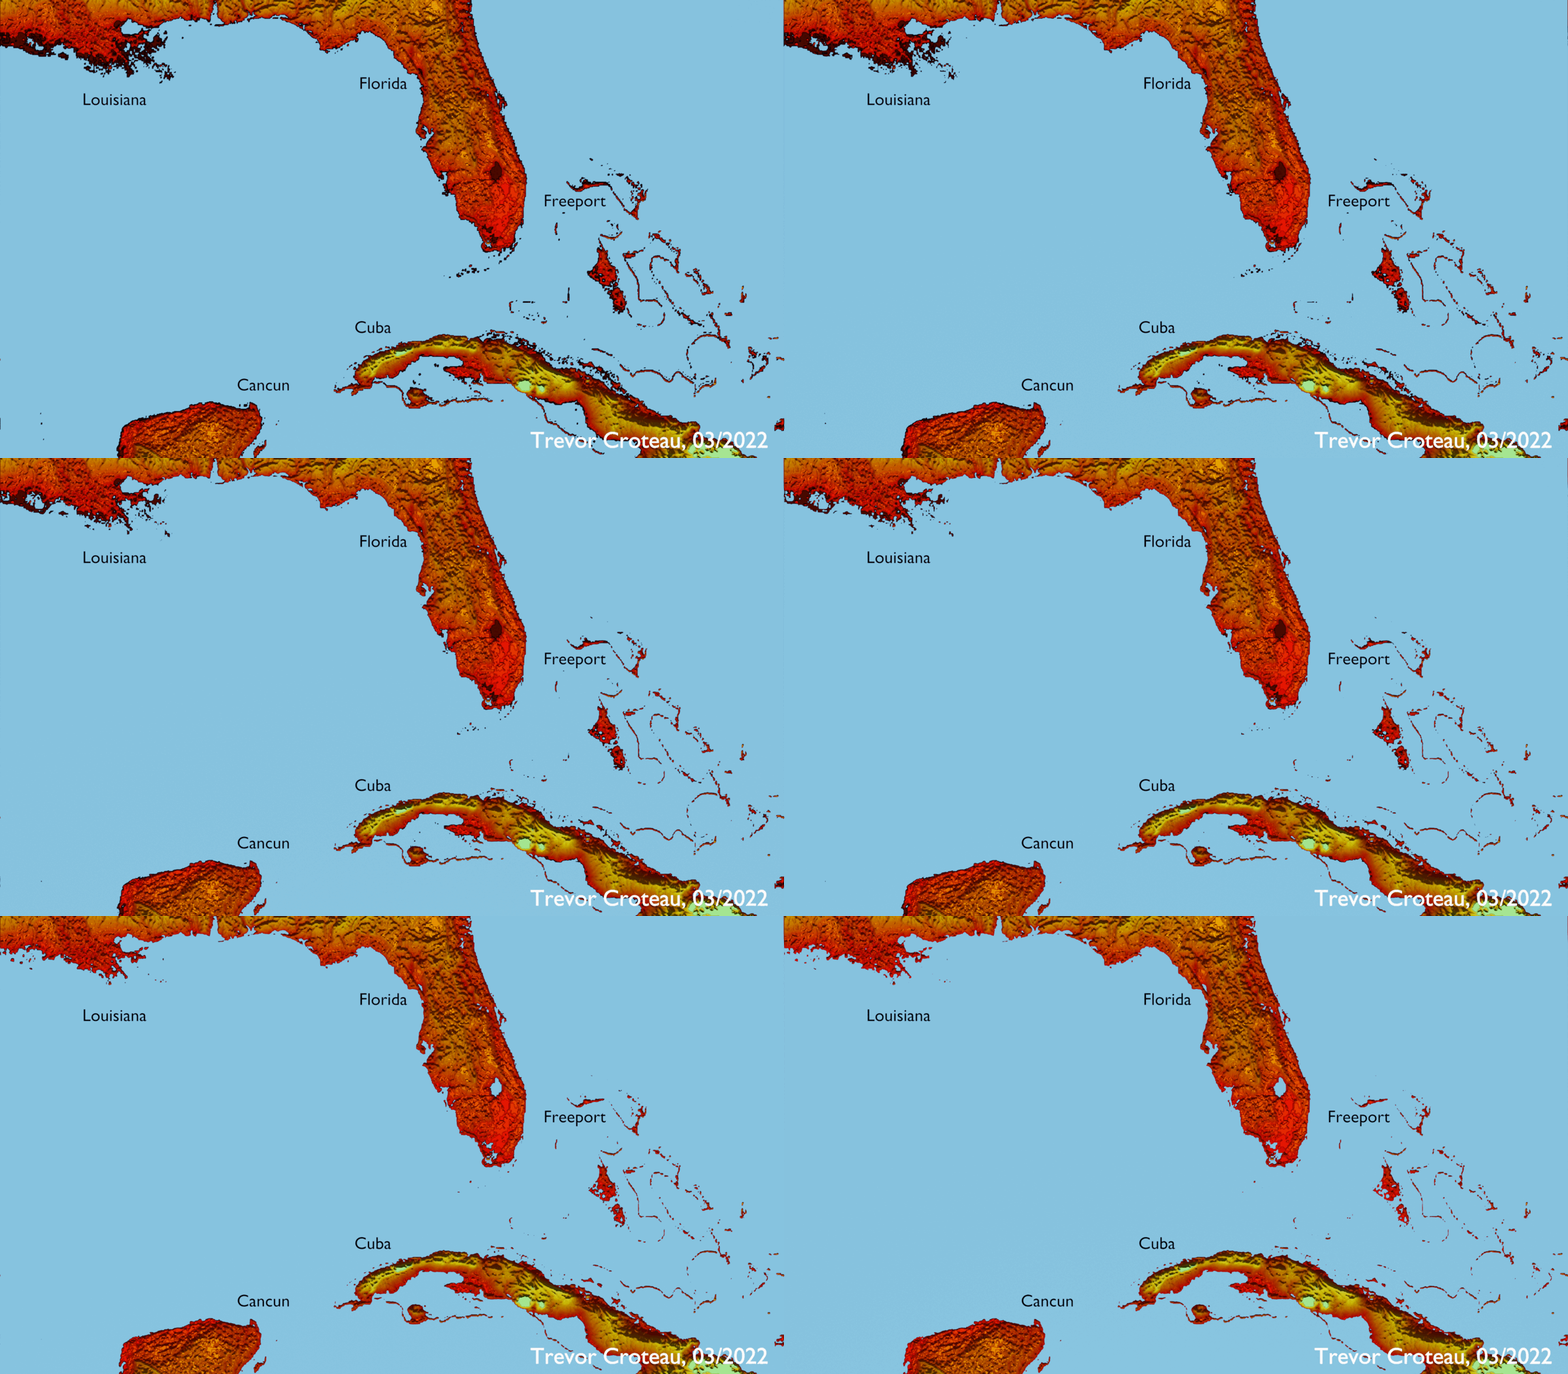
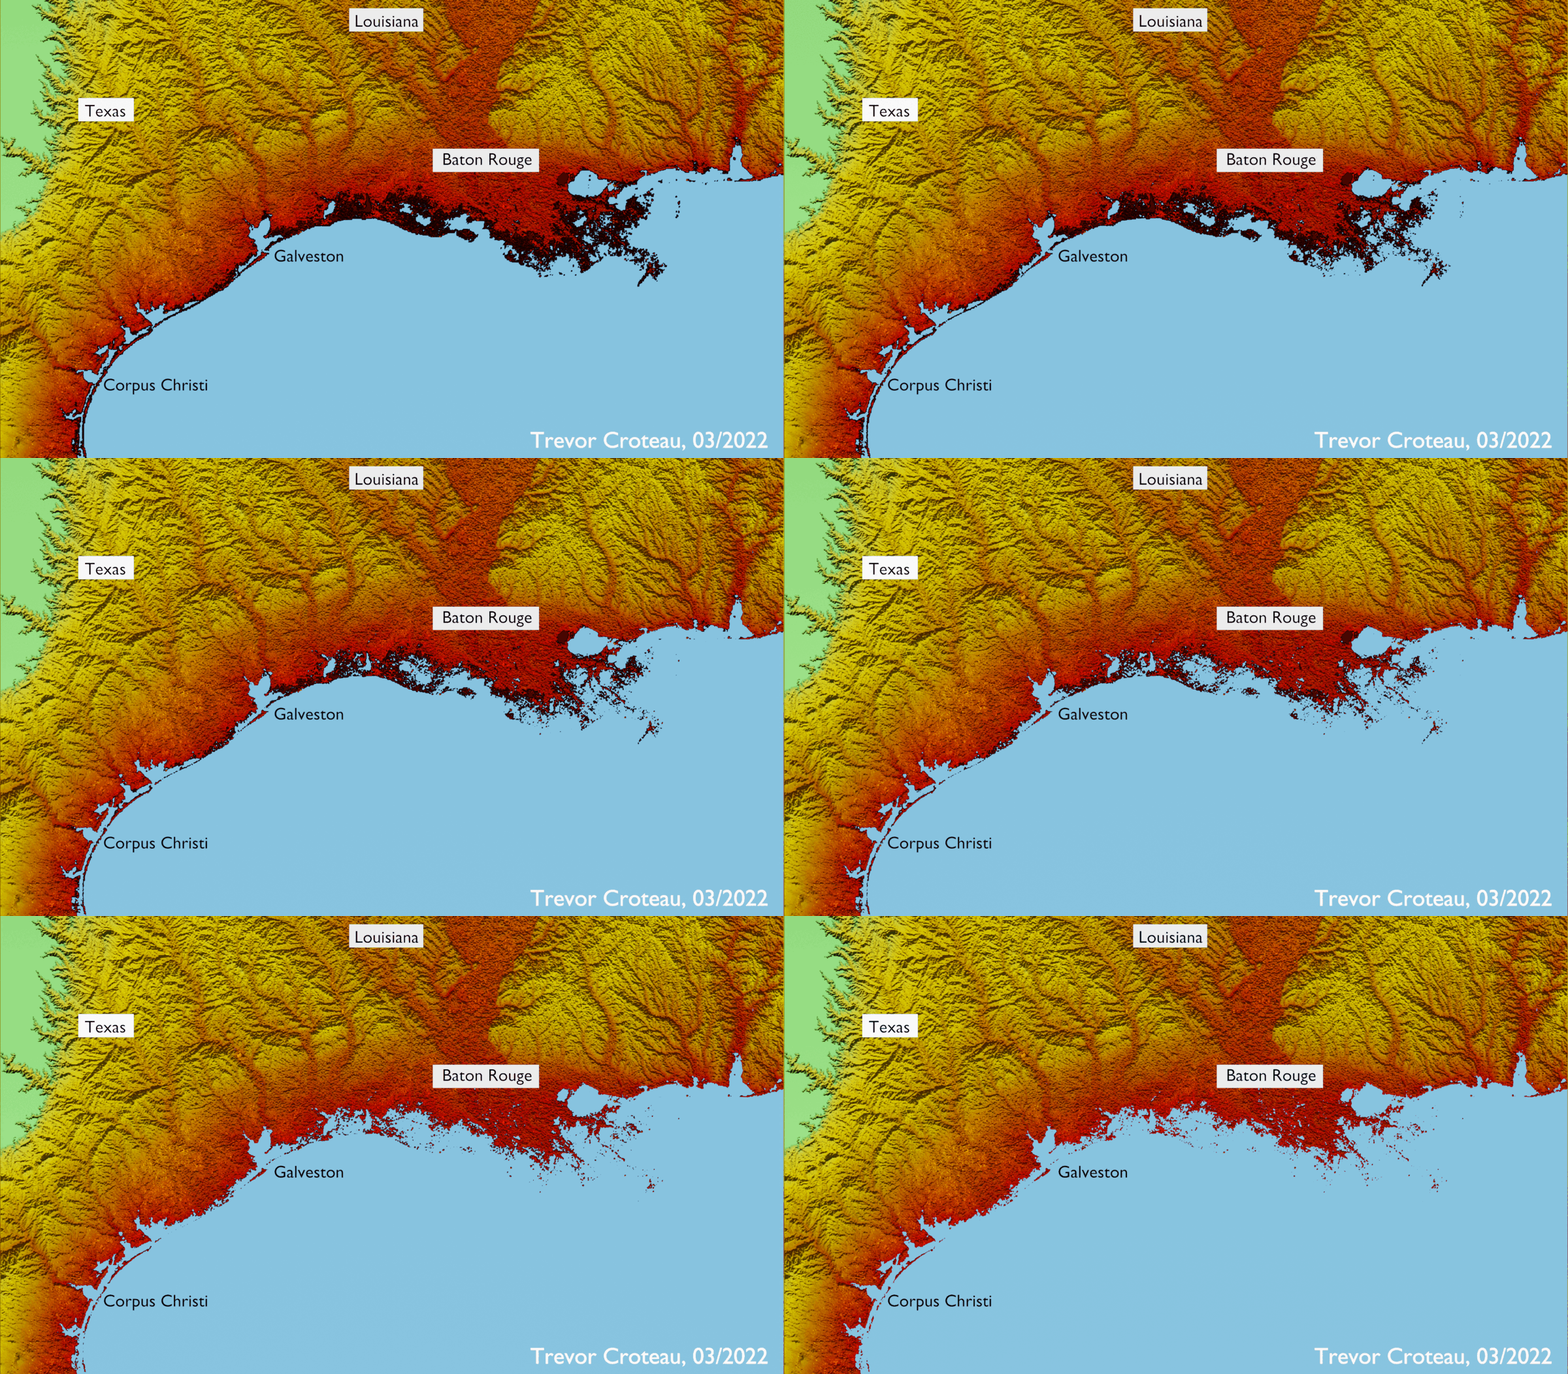
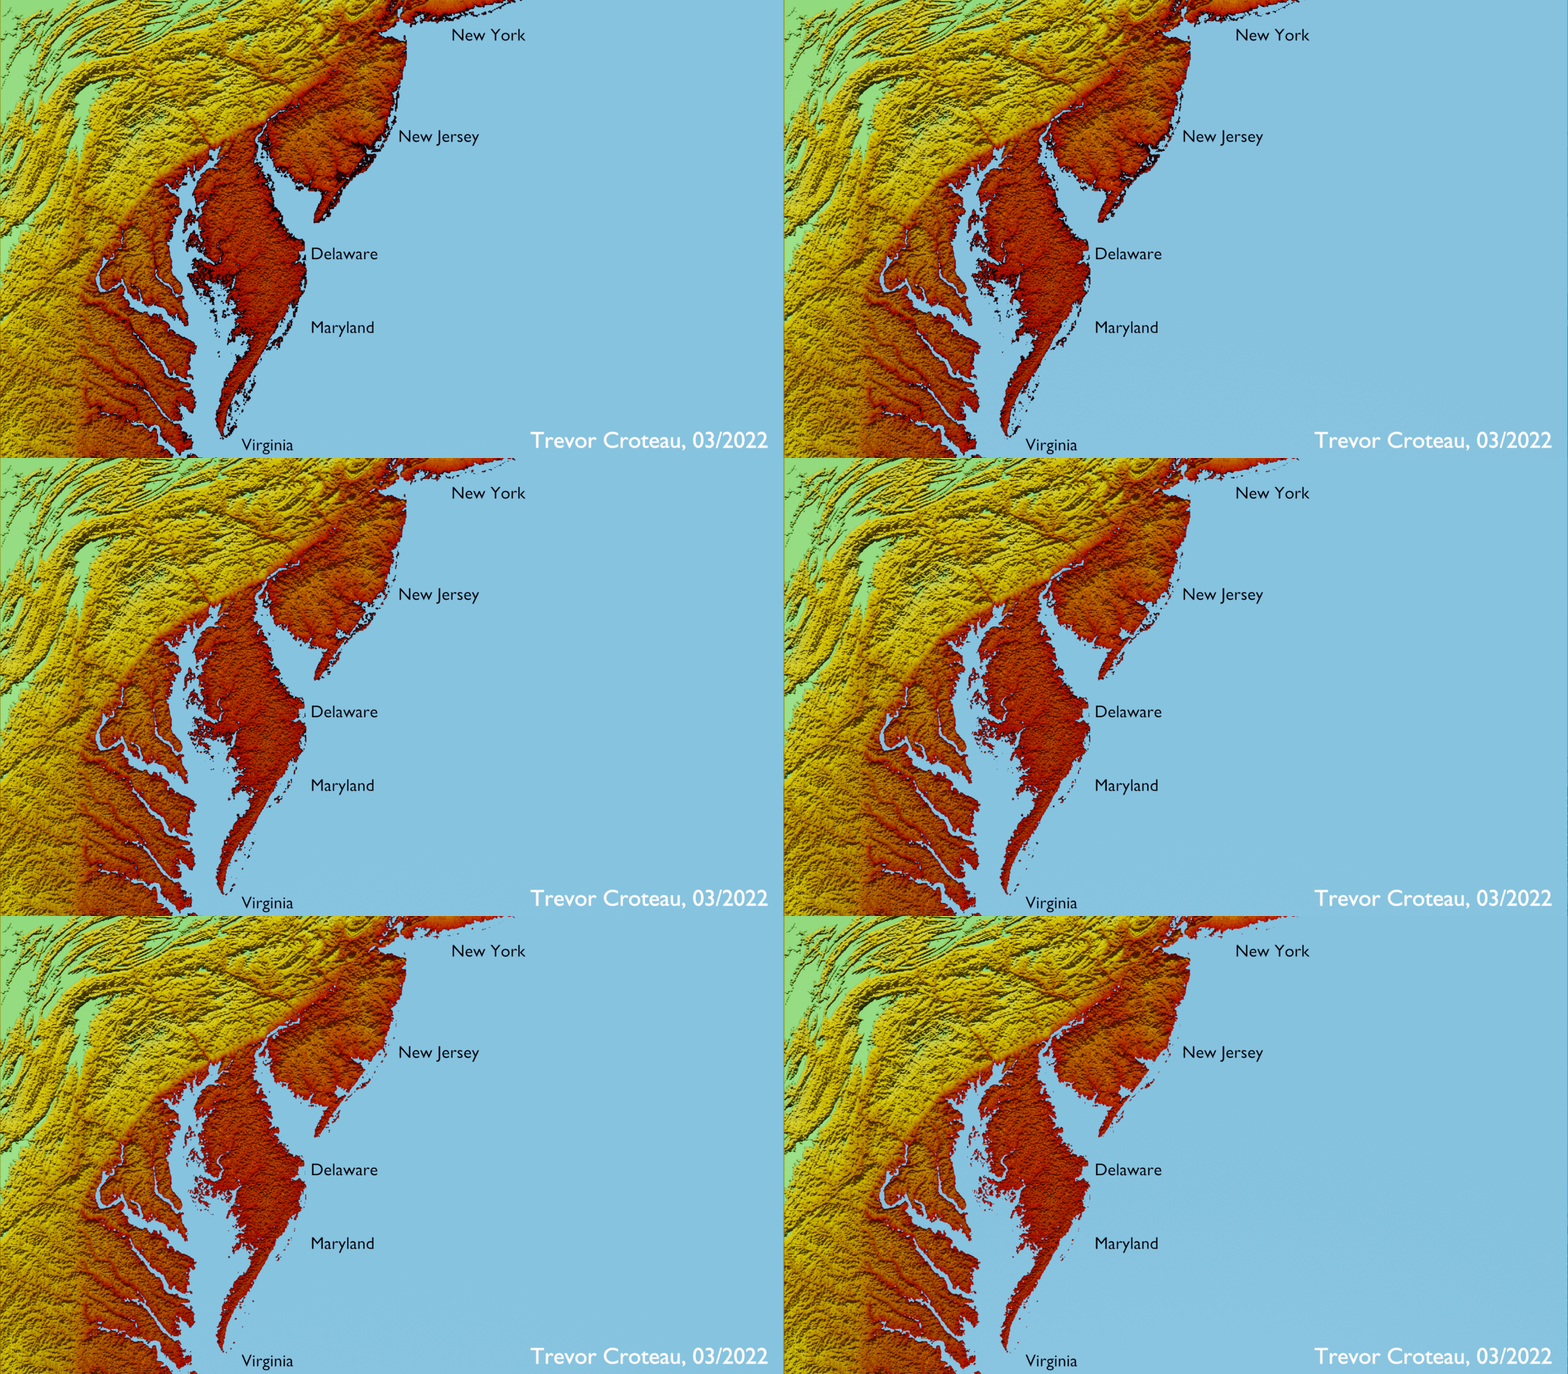
Changing Sea Level Animations
Although it is not made clear in the images, they run from 0ft change in sea level to a 10ft change in sea level. This is instead made clear via the website’s UI.
Florida Bathtub Model (10 feet)

Texas Bathtub Model (10 feet)

New Jersey Bathtub Model (10 feet)
